In ‘The Story of COGS’ I use a Venn Diagram of three intersecting circles to show the intersection of Concepts, Technology and Applications. At the intersection we have collaboration, projects and partnerships (see posts Background Story to the COGS and CCA Relationship and Tour de COGS).
This came to mind yesterday, as I was reading my emails.

From GoGeomatics Canada, Chris North had written an article ‘ The GIS industry at an Existential Crossroads’. I remember Chris from his twenty years with Esri Canada.
The second email was a notice from Esri Canada about a webinar on June 19 ‘ Sky bound solutions. Drones revolutionizing AEC practices.’.
AEC stands for Architecture, Engineering and Construction. In essence, it is the application of GIS to the ‘ built environment’.
From my opening slide ‘ Fifty years of GIS and RS at COGS’, it shows me on our ‘walk to Georgetown in 2013. The message is simple. You have to ‘walk the talk’.
In this case, walking from Yarmouth, NS on the Rails to Trails to Georgetown , PEI to attend a conference on rural economic development in Atlantic Canada. To join Zita Cobb and others in the celebration of living in rural communities.

The message is also true from Edward Wedler. In the same time frame, he invented the venue ‘Ride the Lobster’, an 800km unicycle relay race around Nova Scotia (i.e. ‘the lobster’)
One final link, from Maria Popova, I received my weekly newsletter. The Marginalian. June 9, 2024.

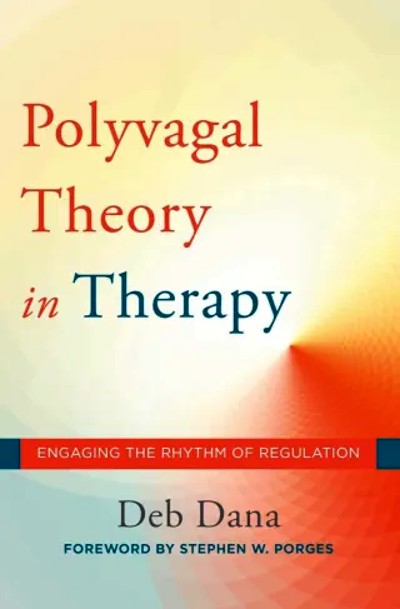
Today, it was ‘Polyvagal theory and the neurobiology of connection’. Check it out.
References
Bob Maher and Heather Stewart, 2014, The Story of the College of Geographic Sciences: A Nova Scotian experiment in Technical Education.
